Prev
Next
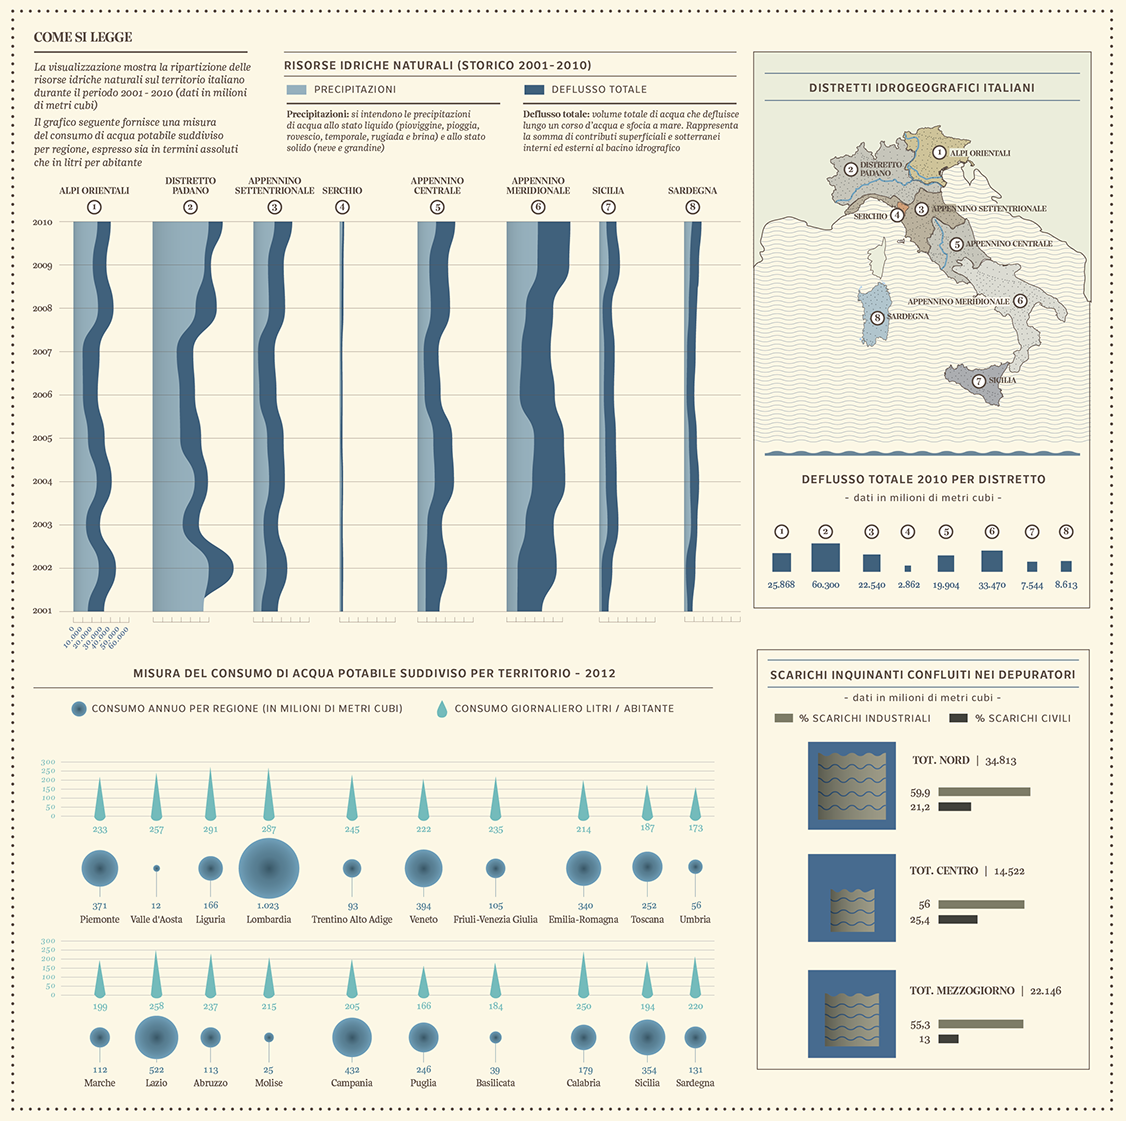
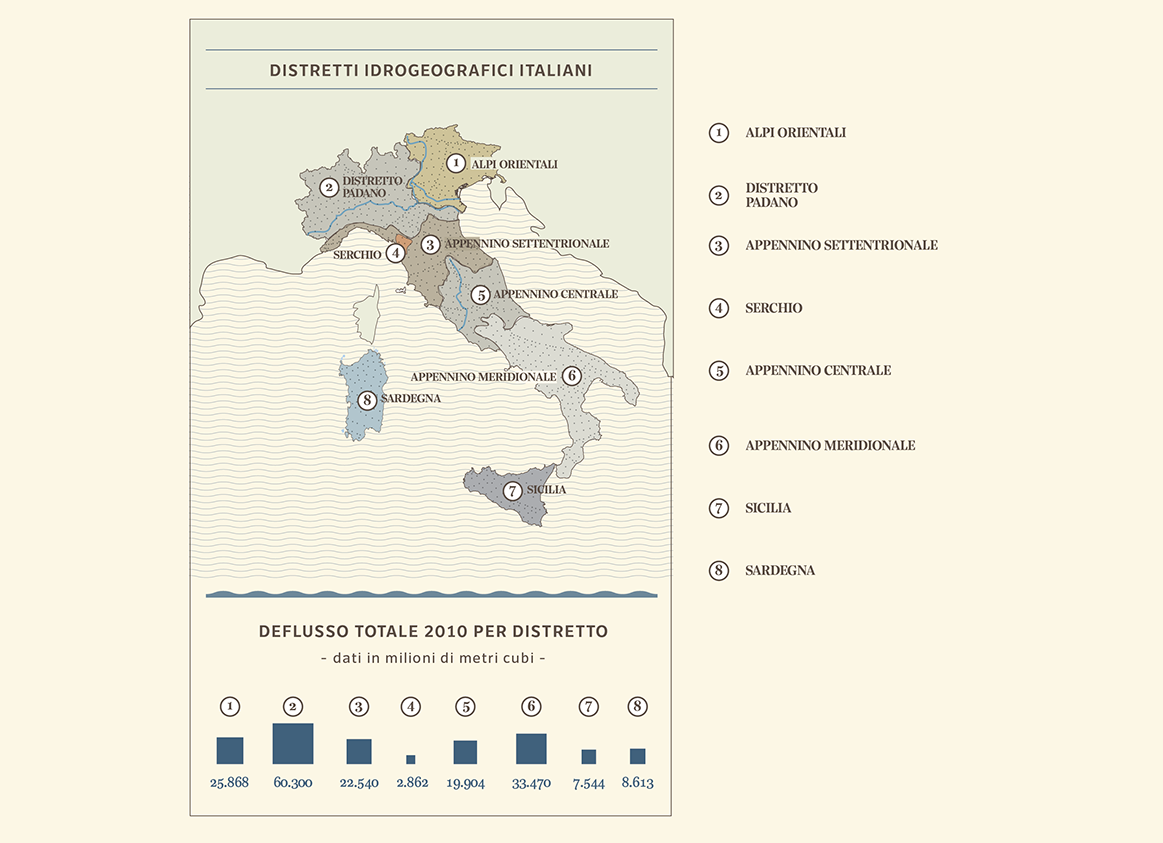
The following visualization returns a detailed picture of water
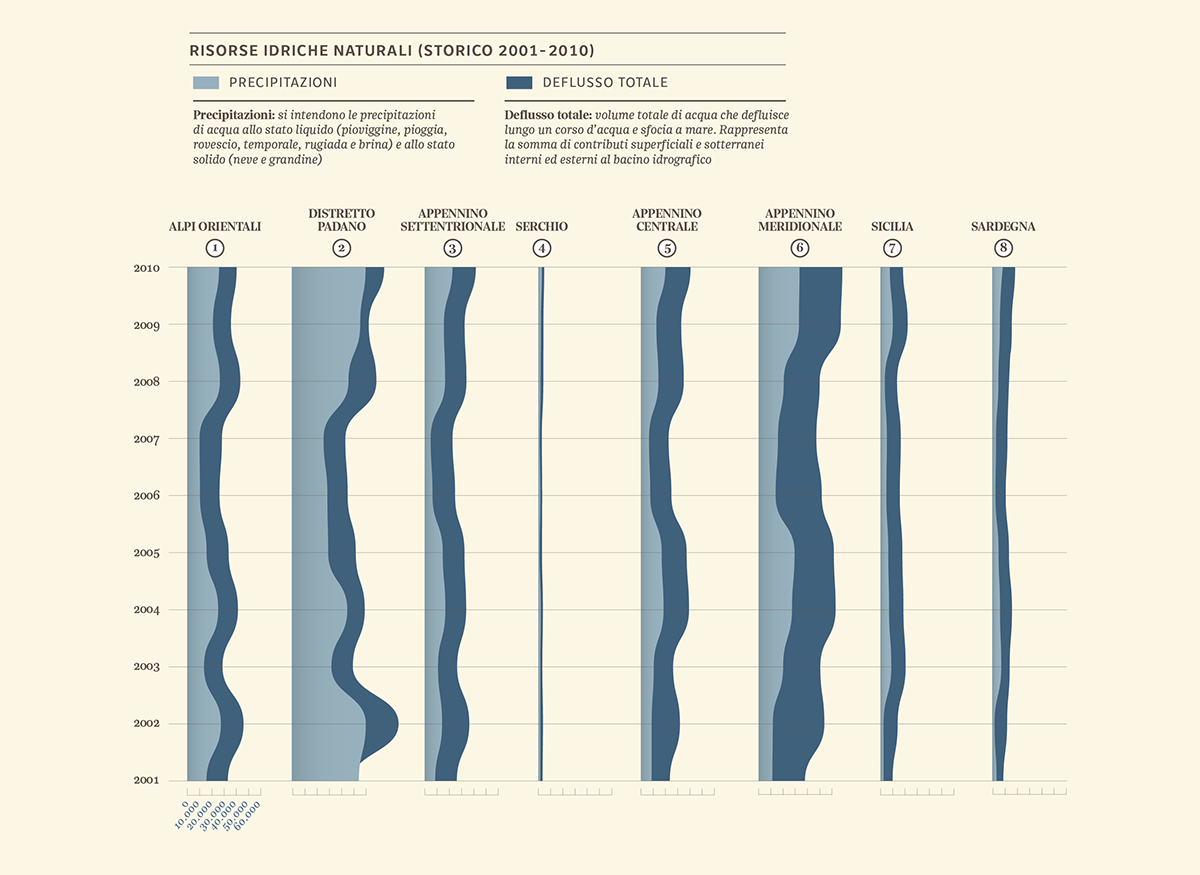
resources distribution in Italy. The blue flows on the top identify
the eight water-districts on the territory and show trends of rainfall
(light blue) and of total water resources (blue) during the last ten years.
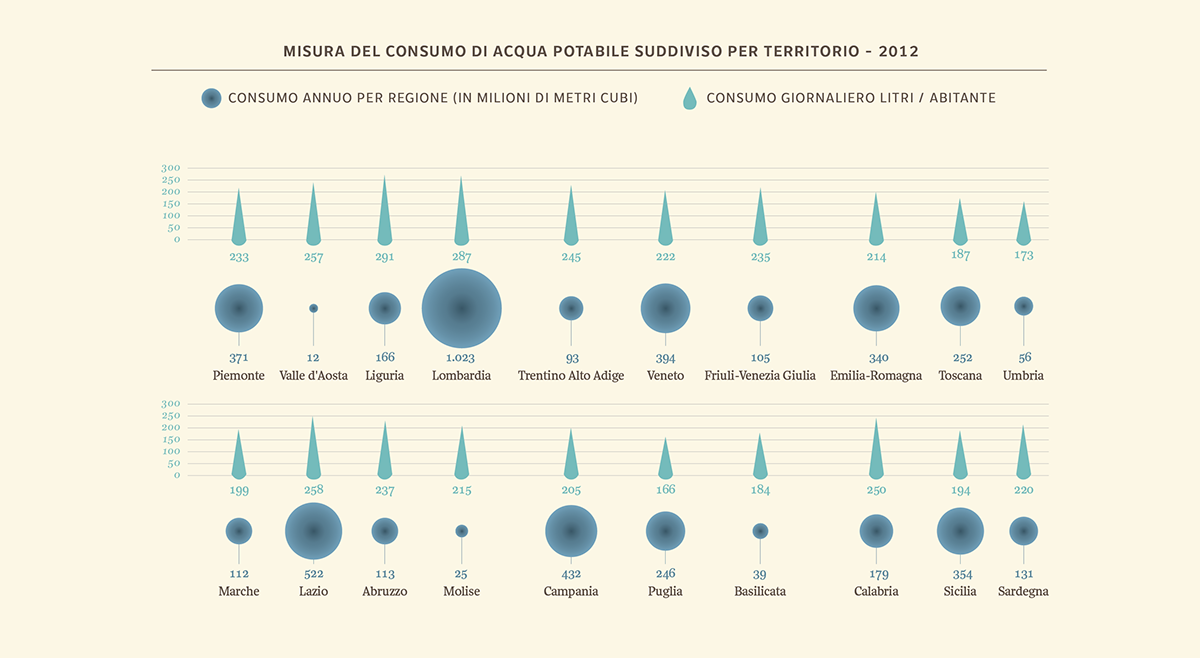
A second graph at the bottom measure - for each region - the annual
consumption of water as well as the daily consumption per citizen.
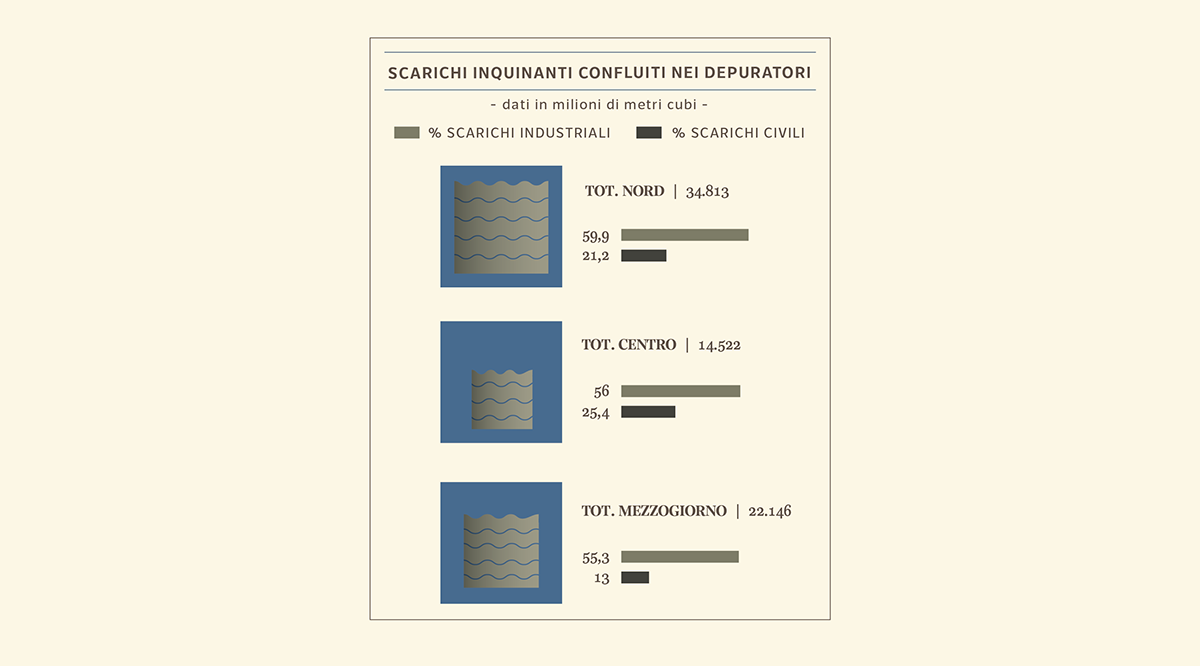
On the right the numbers related to industrial and private contaminants
collected in water purifiers (north, centre, south of Italy) are shown.